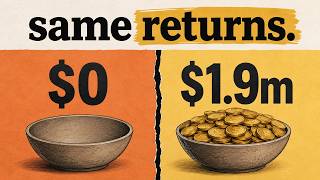
Plug in your numbers and watch compound interest do its thing. The gap between starting and not starting is bigger than you think.
Final value
$0
Total contributions
$0
Interest earned
$0
0% of total
| Year | Contributions | Interest | Balance |
|---|
Compound interest is growth on top of growth. In year one your money earns a return. In year two you earn a return on the original amount plus last year's gains, and the cycle repeats. It works like a snowball rolling downhill: small at first, then picking up mass from every layer it has already collected.
That is why the curve on this page looks flat for the first stretch and steep at the end. Early on, most of your balance is money you put in. Later, the gold portion of the chart, the interest, quietly becomes the larger share. The gap between starting now and starting later is mostly made of those late, steep years.
The math uses monthly compounding. Each month, your balance grows by one twelfth of the annual return rate, then your monthly contribution is added. That repeats for every month in your time period, starting from your starting amount.
The three result cards split the outcome for you. Final value is the total balance at the end. Total contributions is your starting amount plus every monthly deposit. Interest earned is the difference between the two: the part the market did for you. In the chart, the dim segment of each bar is your contributions and the gold segment is interest. The year-by-year table shows the same three numbers for every single year, so you can see exactly when interest starts outworking your deposits.
How often is interest compounded in this calculator?
Monthly. Each month the balance grows by one twelfth of the annual rate, then your monthly contribution is added. Monthly compounding is a common convention for long-term investing estimates and sits close to what most index funds and savings products deliver in practice.
What is a realistic annual return to use?
It depends on what you invest in. Broad stock index funds have historically averaged around 7 to 10 percent per year over long periods, before inflation, while savings accounts and bonds sit lower. Past averages do not guarantee future results, so it is worth testing a cautious number and an optimistic one and looking at the range between them.
Is anything I enter stored or sent anywhere?
No. Everything runs in your browser. Nothing you enter is saved, sent, or tracked. Email signups are not open yet, so this page never asks for your email address. Closing the page clears everything you entered.
Signups are not open yet.